Thursday, May 17, 2012

Wheat: 'Cereal' Underperformer No More

For those that follow the grain markets, I'm sure you must be aware of Wheat's relative underperformance to corn and beans over the better part of the past 2 years. I believe this may be coming to an end, as it appears some serious buying has entered the picture and the technicals speak well to its future prospects.


The weekly chart tells a story of repetitive patterns. From '08-'10 wheat was bottoming in a wedging type pattern, making multiple nominal lows, but not breaking down. Throughout the time, positive divergences were forming in the RSI and MACD indicators. We have a similar situation occurring over the past couple of years with the look of an upside break approaching. 

We've made a very strong move this week, breaking above the tenkan-sen and kijun-sen on strong volume and the chikou span has finally been able to clear prior price congestion. Similarly, we've cleared both the 10 and 30 week MA's on volume, with a flattening 30wk. 

Potential resistance will come from kumo (cloud) just above.


The daily chart gives us a clear view of the sideways action we've put in over the past 7 months. We've spent a great deal of time in what looks to be a bottoming process. There is evidence of accumulation especially in the current calendar year. 

We've cleared the kumo this week and a bullish tenkan-sen cross will occur on any new nominal high from this point forward. A bullish MACD centerline cross is imminent and RSI has remained firmly in bullish territory, consistently holding the 38 level.


Zooming into the 4h chart, we can see the strength of the move over the past 2 days. We managed to breakout of a downchannel on heavy volume and are currently in overbought territory. A sideways consolidation would not be unexpected and a solid opportunity to enter what could be the beginning of a very strong trend.


The chart above is a daily chart of the wheat-corn spread. It has held in a fairly narrow range over the past year, but is now once again nearing the highs. These highs are far from the traditional spread between these products, where wheat has averaged a ~1.46 premium. I think we are about to revisit those levels.


Finally, we have a weekly of the soybean-wheat spread. We recently touched extreme levels here and got firmly rejected. Looking for some mean reversion to occur here.

As timeframes and risk tolerance vary for most traders, I have trouble giving exact entries, stops, etc. for this post. However, I believe there are plenty of different points for traders to be able to enter into a long trade. One could wait for a breakout of the weekly falling wedge, a break of the past year's range, or look for a bull flag/consolidation over the next few sessions to buy the dip. 

BONUS: A few quick setups in the agriculture/soft commodity space that I am very high on.


Oats are set up beautifully. We've entered an ichimoku uptrend on the daily chart as evidenced by the bullish cloud. Confluence support was found this week at the 50day MA and top of kumo. Oats have been in a 1+year downchannel and a breakout appears imminent. 

One thing to keep in mind is that trading in this product is a bit thinner than other grains.


Cocoa is attempting to break out of a 1+ year downchannel as well. The tenkan-sen has crossed above the kijun-sen and we are currently in a symmetrical triangle (not drawn). I am currently long and I believe that cocoa is in the process of bottoming here. However, we're currently on the cusp of falling back into the prior channel and the weekly close should be extremely important.


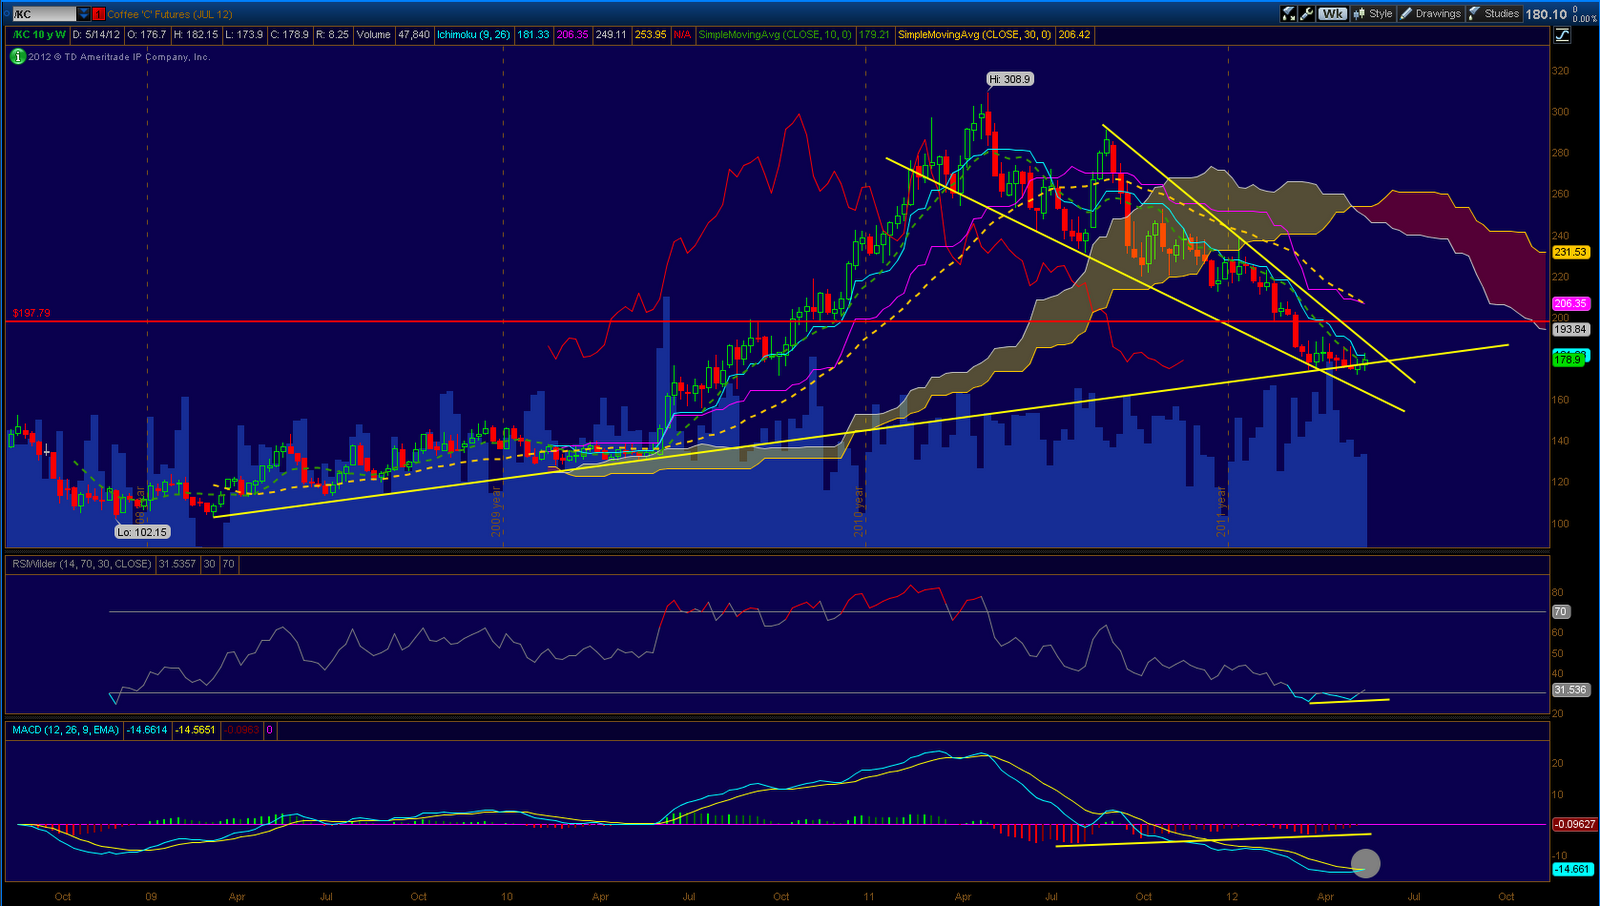
Finally, coffee, which has been beaten down severely, is in a compelling area to buy. We can see support from a 3 year uptrend line and a move towards the top rail of a falling wedge. Positive RSI/MACD histogram divergences are apparent and a bullish MACD cross is imminent. 

The daily chart is holding just below the 50d MA, along with positive RSI/MACD divergences. I'd be a buyer on a high volume move and hold of the 180 level (which we were briefly over today). 

Sunday, January 15, 2012

Crude Oil (CL) Weekly Outlook/Strategy (01/15/12 - 01/20/12)

Towards the end of this week we saw an awesome intraday reversal, with a great trade to be had on Friday. The thinking is that we will be back into "sell the rips" mode from here.


Weekly: We continue to see those topping candles on increased volume each time we near channel resistance. Some divergences are now appearing on the RSI and MACD histogram. Tenkan-sen has acted as support but is now flat. A break of our uptrend line would be significant here.

The action at these levels is most definitely not what I'd consider bullish. It appears to me that we may eventually head back to the low 80's if not lower.


Daily: As I've written about previously, I believe the 97.53 area is HUGE as a pivot. From a daily perspective we neared broke our trendline, this past Friday, but bounced off our kumo and pivot area. Significant negative divergences appear on RSI/MACD, with MACD rolling over and a bearish centerline cross imminent.

Chikou has fallen below prior price and tenkan-sen is now heading lower. I will re-emphasize the importance, in my opinion, of that 97.53 area. Below you want to be bearish. Regardless, I do not believe a breakdown here will be easy. As thick as the kumo is, expect some backing and filling before we are to see any sharp downside moves.


240 minute: The 4 hour timeframe shows that we managed to hold our uptrend line on Friday. A break through this level gives the go-ahead for a short trade with confirmation coming on a move below 97.53 (denoted by pink line). Near term resistance should be found at 100.50 - 101.00 area.

Sunday, January 8, 2012

Futures Charts of Interest (01/08/12)

Starting the week off looking at some bond charts, we are clearly sitting at critical levels here. All of our bond charts (30-yr, 10-yr, 5-yr) are bullish from an ichimoku perspective. Respective kumo are bullish, tenkan-sen above kijun-sen, and chikou above prior price levels. 

Shorter terms bonds have held up better, relatively, than the 30-yr, which essentially pierced it's recent uptrend line. We have been basing out for the past 4 months or so and I believe it will soon come time to see whether or not the complex has been setting up for continuation higher, or a possible reversal or trend.


The chart above is for the March Eurodollar (/GE) contract. Clearly we can see an inverted H&S pattern with a neckline breakout looking imminent. A breakout here brings us a measured move to 99.72, which would equate to new contract highs. I would love to hear some thoughts on the implications of such a move from some of the bond guys, whom I respect dearly (you know who you are).


Above we have a 240 minute chart of copper. Many traders have been watching copper do its triangulation thing over the past months and, here too, we appear to be coming to a resolution. We broke out of a smaller triangle within our triangle last week and appear to be coming back to backtest. 

We are sitting at a critical area. If the 3.39 level is not held, I'd expect to see an attempt at a downside break, and vice versa. Very difficult to anticipate anything here.

I believe all these charts along w/ my analysis of crude here, point us to the fact that the stars seem to be aligning for our next significant movement in our markets. My guess, if I had to make it, would be to lean higher in the commodity and equity space, along with a potential bond top. Regardless, it'll be important to watch for a resolution of these patterns as well as follow through.


Wheat has treated me well over the end of 2011 and beginning of 2012. I believe we may be in a massive longer term falling wedge. Shorter term, I am watching the current levels to try a long entry. I think the charts above are pretty self-explanatory but please do not hesitate to ask if you have questions or disagree.

Crude Oil (CL) Weekly Outlook/Strategy (01/08/12 - 01/13/12)

Going into Friday, I was watching for the clear possibility of crude throwing up a weekly shooting star/reversal candle at prior channel resistance. However, there was some real strength in the entire complex, with quite an impressive move out of /HO and /RB in particular, that negated the weekly reversal candles.

I believe the chart shows an upward bias but we have to keep our minds open to multiple potential scenarios. At this point, the stars seem to be aligning for a sharp move with clear areas to initiate trades, both long and short, w/ solid potential R/R.


Weekly: The weekly ichimoku chart is neutral to bullish. The rising tenkan-sen is above the kijun-sen. Chikou is above prior price with clear air from here. Our 10-wk ma is rising and above the 30-wk ma which is flat. MACD and RSI are both positive and rising. 

However, kumo still remains bearish and will not flip bullish until we can make new closing highs. An area of concern would be the topping tails that have resulted on increased volume on each touch of prior channel support. This rail has clearly turned into resistance.


Daily: The daily chart is bullish. Kumo is in a clear bullish trend. Tenkan-sen has acted as support last week, and is rising and above the flat kijun-sen. Kijun-sen will stay flat unless new highs are made. Chikou is above prior price. As we made new highs last week, we are able to draw a new flatter uptrend line which could provide a more sustainable trend. We have our clear resistance above at 103.38. Closing above this level gives us a breakout with a measured move to 131.88. More major resistance levels above come at 106 then 113.70, 122.50, and 131.8.  

The only potential bearish point would be a bearish engulfing candlestick formed on Thursday, at resistance, on increased volume. A break below Friday's lows may lead to an uptrend test down towards the key 97.53 pivot. 


240min: The 4 hour chart is bullish. We can see a clear inverted H&S pattern with horizontal resistance. I've also drawn in the possibility of a rising neckline. 

This timeframe has formed a negative divergence on our MACD and RSI. Kijun-sen has been holding as support and will rise considerably on the open today. A move below may take us to our nearest support area 99.97-100.15. 


60min: This shorter timeframe is neutral to bearish. Kumo is bearish and tenkan-sen has crossed below the kijun-sen. We appear to be flagging in a channel and have backtested our smaller inverted H&S neckline that I discussed last week. Ideally, in our bullish scenario, we would like to hold our neckline and get long on a channel breakout. An area of concern on this timeframe would be that our selloffs are coming on increased volume.

Overall, I believe most parties will be anticipating an upside break. I believe that we may continue to see some choppy action for an extended period. I've included charts of /RB and /HO below and as is clearer on the longer term timeframes, they've been somewhat rangebound. Clear breakouts from these two would verify a bullish case in the energy complex.


The stars appear to be aligning with some type of major move in the markets coming very soon. I will have another blog post up this evening with some of the other markets I have on my radar. Thanks for reading and good luck trading this week!

Monday, January 2, 2012

Crude Oil (CL) Weekly Outlook/Strategy (01/02/12 - 01/06/12)

Happy New Year! Hope everyone had a safe, fun celebration over the weekend. Frankly, I can't say that that I have a great read on crude oil going into 2012. Many traders, I'm sure, have the potential Iran situation on their radar. I cannot trade off that information so will keep it in mind but try to to remain objective in my analysis of the technical situation. 


Weekly: The weekly chart of crude continues to give a lot of mixed signals. Kumo has continued to contain price along with the lower rail of our prior upchannel. We have a rising 10-wk MA and tenkan-sen, which are both above the 30-wk MA and kijun-sen.

If/as price continues to hold these levels, our bearish kumo will soon flip bullish and chikou will definitively be able to clear previous prices. I will not rule out the possibility of extended and continued choppy/trendless action from here.


Daily: the trend (as shown by the kumo) is decidedly higher. MACD has bounced off its centerline and RSI is holding in bullish territory. However, the flat tenkan-sen is below a flat kijun-sen and these should act as magnets for future price action. 

I am sure many have been watching the flag/channel that was forming over the past weeks. I believe that pattern is most likely going to morph into something else. Zooming out a bit, we see the potential for a large inverted H&S pattern with a left shoulder beginning in May and currently forming a potential right shoulder.

From a shorter term perspective, we made a lower low and a potential lower high last week. This is something to be aware of if we are to see a potential trend change here.


240 minute: Here we can see our potential right shoulder I discussed above. Within our right shoulder, we see the potential for a continuation inverted H&S fractal. We've seen continued choppy action from this timeframe and signals are mixed. Chikou has fallen below prior price levels, flat tenkan-sen is below flat kijun-sen with current action below both levels.

The two key pivots beneath for me are shown. I believe the 97.50 area will be very important. Above this level I am bullish, and willing to buy the first test of this area as well. The next important pivot will be 95.20 area. Below this, I am a full blown bear.

We also have a potential neckline of our potential H&S which I would get long on a break


60 minute: We are a bit more bearish on the shorter term timeframe. From an ichimoku perspective, all signals are currently bearish with the exception of kumo flipping bullish. We are sitting at potential trendline support. Resistance levels on this timeframe will be at the 99.87 area then 101.40. Support once again, 97.50 then 95.15.

I would like to wish everyone the best of luck and success in 2012. I will try to continue to share my weekly research. Please let me know if you find this at all useful or even disagree and have a different perspective. Thanks for reading.