Showing posts with label $ZW_F. Show all posts

Sunday, January 13, 2013

Commodity Run Coming?

Long time no post! Over the past few months I've become significantly busier with my other professional obligations such that I haven't had the time to post anything here or much at all through Twitter. I've made some commitments that should occupy a majority of my professional time which has caused me to have to extend my trading time horizons. No longer having the time necessary to follow the markets tick for tick each day, the setups I discuss and take will generally be those which I feel can sustain 6-18 month holds/moves.

Looking at some charts of the commodities, I believe the past year or so action has been quite constructive and we are setting up for some larger moves across the board.


Taking a look at the CRB/SPX ratio, we are sitting at a significant level of support that's been established over the past decade. We are really sitting at a critical area where a bounce could have some very positive ramifications. Technically, a bounce here would give us a double bottom (W) along with positive divergences both on the RSI and MACD.


Sugar (SB) is one of my favorite current setups. Almost all of the softs have been beaten down and trying to bottom. It is currently sitting just above a 4+ year uptrend line and has been constructing a falling wedge over the past 2 years. The price action has tightened up significantly over the past months with bullish divergences developed in both the RSI and MACD. I'm looking for a break of this wedge with an initial target of 24-26 and PO = 31.60.

Disclosure: Currently long 21 calls expiring in March and April.


Crude (CL) broke its upchannel in 2010 and backtested it early in 2011. Since then, we've seen a sideways base on declining volume. We are currently in a textbook symmetrical triangle with a breakout imminent. A breakout should coincide with a bullish MACD centerline cross and a PO = $120.


Copper (HG), as well, broke its multi-year upchannel late in 2010 and since has been moving sideways into a symmetric triangle. Another case of declining volume, which is what you want to see. MACD is positive, and you want to see the chikou span clear the 3.82 level. PO out of triangle = 4.60.


Was calling for a natural gas (NG) bottom last year and we saw an inverse H&S break. After backtesting the neckline, natty made a b-line for the top of its downchannel. Seeing some hesitation at this level, however, we now have cloud support and should continue to see an extended move. $5 is the key level. The last two candles are quite supportive with bottoming tails at the 30wk MA as well as price holding the kijun-sen. 


If you go back to my last point, I made a pretty nice call on wheat (ZW). It has yet to meet the price target of its bullish wedge breakout of last year which is about the 965 level. I believe we are in a great spot to buy the dip with uptrend support as well as cloud support. Watching the chikou-span, look for a bounce at the prior tenkan/kijun. We may triangulate a bit further before moving higher.

Thursday, May 17, 2012

Wheat: 'Cereal' Underperformer No More

For those that follow the grain markets, I'm sure you must be aware of Wheat's relative underperformance to corn and beans over the better part of the past 2 years. I believe this may be coming to an end, as it appears some serious buying has entered the picture and the technicals speak well to its future prospects.


The weekly chart tells a story of repetitive patterns. From '08-'10 wheat was bottoming in a wedging type pattern, making multiple nominal lows, but not breaking down. Throughout the time, positive divergences were forming in the RSI and MACD indicators. We have a similar situation occurring over the past couple of years with the look of an upside break approaching. 

We've made a very strong move this week, breaking above the tenkan-sen and kijun-sen on strong volume and the chikou span has finally been able to clear prior price congestion. Similarly, we've cleared both the 10 and 30 week MA's on volume, with a flattening 30wk. 

Potential resistance will come from kumo (cloud) just above.


The daily chart gives us a clear view of the sideways action we've put in over the past 7 months. We've spent a great deal of time in what looks to be a bottoming process. There is evidence of accumulation especially in the current calendar year. 

We've cleared the kumo this week and a bullish tenkan-sen cross will occur on any new nominal high from this point forward. A bullish MACD centerline cross is imminent and RSI has remained firmly in bullish territory, consistently holding the 38 level.


Zooming into the 4h chart, we can see the strength of the move over the past 2 days. We managed to breakout of a downchannel on heavy volume and are currently in overbought territory. A sideways consolidation would not be unexpected and a solid opportunity to enter what could be the beginning of a very strong trend.


The chart above is a daily chart of the wheat-corn spread. It has held in a fairly narrow range over the past year, but is now once again nearing the highs. These highs are far from the traditional spread between these products, where wheat has averaged a ~1.46 premium. I think we are about to revisit those levels.


Finally, we have a weekly of the soybean-wheat spread. We recently touched extreme levels here and got firmly rejected. Looking for some mean reversion to occur here.

As timeframes and risk tolerance vary for most traders, I have trouble giving exact entries, stops, etc. for this post. However, I believe there are plenty of different points for traders to be able to enter into a long trade. One could wait for a breakout of the weekly falling wedge, a break of the past year's range, or look for a bull flag/consolidation over the next few sessions to buy the dip. 

BONUS: A few quick setups in the agriculture/soft commodity space that I am very high on.


Oats are set up beautifully. We've entered an ichimoku uptrend on the daily chart as evidenced by the bullish cloud. Confluence support was found this week at the 50day MA and top of kumo. Oats have been in a 1+year downchannel and a breakout appears imminent. 

One thing to keep in mind is that trading in this product is a bit thinner than other grains.


Cocoa is attempting to break out of a 1+ year downchannel as well. The tenkan-sen has crossed above the kijun-sen and we are currently in a symmetrical triangle (not drawn). I am currently long and I believe that cocoa is in the process of bottoming here. However, we're currently on the cusp of falling back into the prior channel and the weekly close should be extremely important.


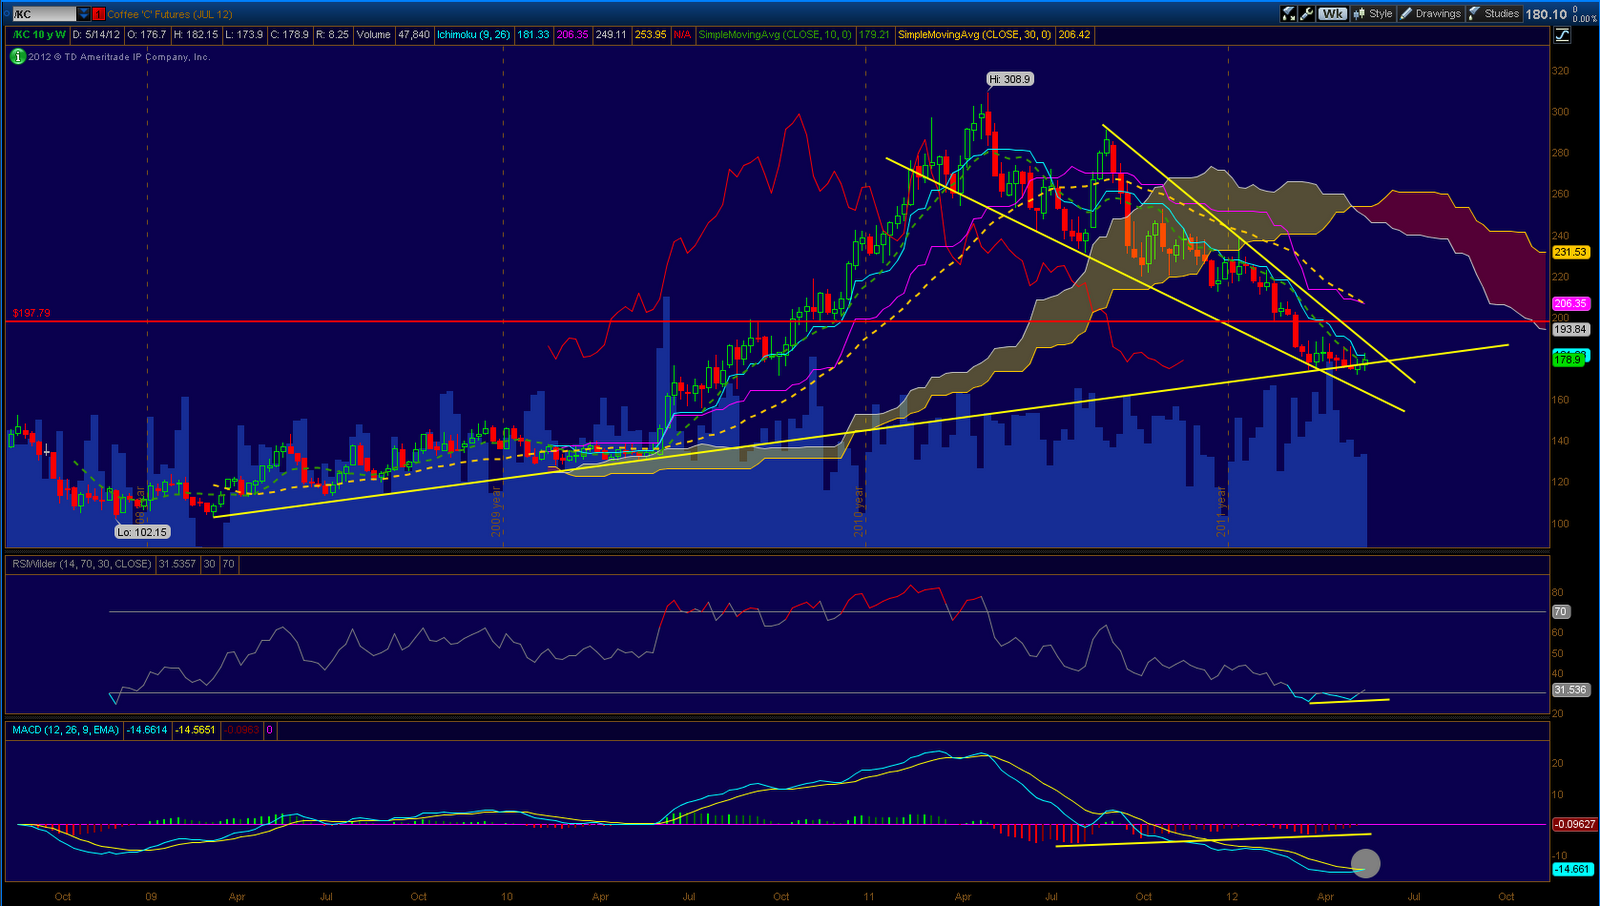
Finally, coffee, which has been beaten down severely, is in a compelling area to buy. We can see support from a 3 year uptrend line and a move towards the top rail of a falling wedge. Positive RSI/MACD histogram divergences are apparent and a bullish MACD cross is imminent. 

The daily chart is holding just below the 50d MA, along with positive RSI/MACD divergences. I'd be a buyer on a high volume move and hold of the 180 level (which we were briefly over today). 

Sunday, January 8, 2012

Futures Charts of Interest (01/08/12)

Starting the week off looking at some bond charts, we are clearly sitting at critical levels here. All of our bond charts (30-yr, 10-yr, 5-yr) are bullish from an ichimoku perspective. Respective kumo are bullish, tenkan-sen above kijun-sen, and chikou above prior price levels. 

Shorter terms bonds have held up better, relatively, than the 30-yr, which essentially pierced it's recent uptrend line. We have been basing out for the past 4 months or so and I believe it will soon come time to see whether or not the complex has been setting up for continuation higher, or a possible reversal or trend.


The chart above is for the March Eurodollar (/GE) contract. Clearly we can see an inverted H&S pattern with a neckline breakout looking imminent. A breakout here brings us a measured move to 99.72, which would equate to new contract highs. I would love to hear some thoughts on the implications of such a move from some of the bond guys, whom I respect dearly (you know who you are).


Above we have a 240 minute chart of copper. Many traders have been watching copper do its triangulation thing over the past months and, here too, we appear to be coming to a resolution. We broke out of a smaller triangle within our triangle last week and appear to be coming back to backtest. 

We are sitting at a critical area. If the 3.39 level is not held, I'd expect to see an attempt at a downside break, and vice versa. Very difficult to anticipate anything here.

I believe all these charts along w/ my analysis of crude here, point us to the fact that the stars seem to be aligning for our next significant movement in our markets. My guess, if I had to make it, would be to lean higher in the commodity and equity space, along with a potential bond top. Regardless, it'll be important to watch for a resolution of these patterns as well as follow through.


Wheat has treated me well over the end of 2011 and beginning of 2012. I believe we may be in a massive longer term falling wedge. Shorter term, I am watching the current levels to try a long entry. I think the charts above are pretty self-explanatory but please do not hesitate to ask if you have questions or disagree.

Saturday, December 17, 2011

Futures Setups I'm Watching (Week of 12/18/11)


Soybeans were on my radar most of last week looking for a squeeze out of this setup. Managed to take a bit out of it but I believe there is still solid potential for a significant move to the upside. Working out of a massive positive RSI/MACD divergence, its downtrend line was broken on volume Friday. It's been in a down channel for almost 3 months and was stopped at the top rail.


The hourly chart shows the resistance encountered at the top of the channel. One can enter on a break of this downtrend line or look for a pullback to the 1120 area. Shorter term resistance levels are 1145 then 1152. Support at 1120 then 1110 areas.


I've been tracking all of the grains for quite some time and felt their charts were some of the nastiest out there. But they've steadfastly refused to break. I am leaning towards wheat developing a falling wedge pattern here as it's made lower lows with positive divergence in the RSI and MACD. If this is the case, there is huge potential here. Of course another way to potentially play this would be through a long wheat - short corn spread I blogged about here.


On an hourly time frame, we've made a falling wedge and within that a small inverted head and shoulder pattern is potentially forming. A move above 586.5-587 on strong volume would be a signal to get long for me. One can also be more cautious and wait for this wedge to resolve to the upside.


I've never traded cattle before but I believe there is a potential short setup here in feeder cattle. We've been in an uptrend with a developing negative divergence. Above is the H (March '12) contract but a similar pattern is forming in other contracts. Kumo has flipped bearish with the tenkan-sen below the kijun-sen. Chikou span (red line) has moved below price. I think a break here gives a solid 10 points of downside. Take a look at Lean Hogs and its breakdown on Friday.


I will be taking a short only here on a break of this rectangle on the hourly to the downside.

Sunday, December 4, 2011

Wheat - Corn Spread Trade Idea

As I did my research over the weekend, I was able to look through a variety of different commodity futures groups such as agriculture and energy to get a better handle on relative performance, historical relationships, etc. A potential trade that popped out to me was a spread trade, ZW-ZC. I have been quite bearish on the entire grains complex for the past month or so, in particular wheat. Although it has continued to grind lower, it hasn't broken as I had anticipated, but I noticed a clear weakness in Corn relatively over the past few sessions that was notable.


The chart above shows an 18-month performance comparison between Corn, Wheat, and Soybeans. Also included are ratio charts comparing the relative performance of each against the other. As is obvious, Corn has clearly been the outperformer of the group with Wheat bringing up the rear. However, the Corn:Wheat ratio chart shows a potential a potential topping type rectangle pattern. I would also note that the Wheat:Soybean ratio looks to be bottoming and the Corn:Soybean ratio is looking at an uptrend line test.


Looking specifically at the daily Corn chart, we see a clear year-long head and shoulder - type topping pattern. Corn seemed to have bear flagged near its neckline and has begun to break down. RSI is pointing downward, Stochastics look to be embedding to the downside, and the MACD failed to make a bullish crossover. Any technical analyst would most likely look at this chart and know where a confirmed break would occur.


The daily wheat chart is similar but a bit different. Wheat also has had a similar year-long head and shoulders type pattern. However, it has a downward sloping neckline, characterized by lower lows. As you can see over the past 2 months, attempts have been made at a breakdown that have failed. All the while, positive divergences have begun to form on the RSI and MACD. We look to have culminated in a fakeout at the end of November and broke a descending trendline on Friday.


The final chart is a spread chart of the H2 contracts (Mar '12). This chart indicates 1 contract long wheat for 1 contract short corn. Basically the difference in value between the two products. If this number is negative, corn is nominally more expensive than wheat, and vice-versa. Looking over the past decade or so, Wheat has had about $1.00-$1.50 premium to corn, although it has varied wildy at the extremes.

As you can see from the spread chart, a potential bottom looks to be forming. There is a significant positive MACD/RSI divergence and from an ichimoku perspective, price has cleared the kumo. I see the potential for an head and shoulders type bottom here and important trendlines have been marked. Ideally, I would like to see a move up to the trendlines and a pullback to the 15-18 area to hopefully be able to enter a position. I think an eventual move to the $1.85 resistance area is possible which would be a 400-700 tick gain/contract depending on entry.

WORD OF WARNING: As you can see from the spread chart, the intraday movement in this spread can get quite volatile. Over the past 6 months, there has been as high as 95 point intraday swing in this pair. As always, risk management is crucial. A difficult thing about executing this trade on IB, which is where I would be, is the lack of ability to place hard stops. If one isn't comfortable with this type movement I believe there are still two strong setups that I've posted above for each individual name. Good luck!